EN
ID
EN
ID
Home
About Us
Company Overview
Vision and Mission
Company Structure
Management
Supporting Institutions
Corporate Governance
Awards & Certifications
Developments
Centro Cinere
Jakarta
Cinere Junction
Karawaci
Sentul
Media
Marketing Activity
Corporate Social Responsibility
Gallery
Investor
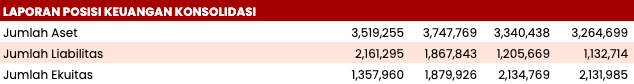
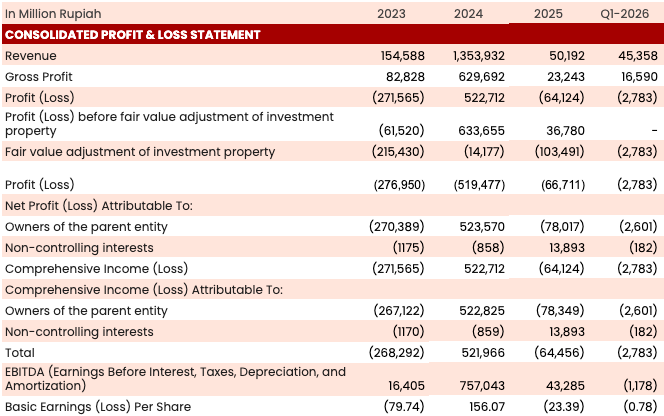
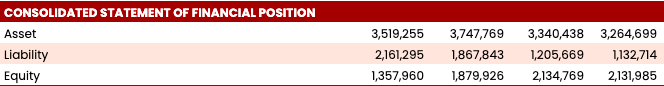
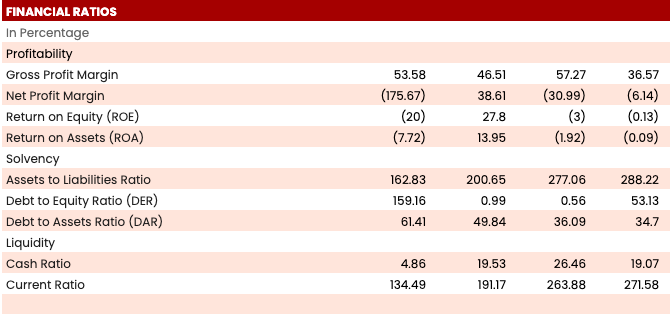
Stock & Financial Highlights
Financial Statements
Annual and Sustainability Reports
RUPS
Information Disclosure and Others
Career
Contact
Investor
Stock & Financial Highlights